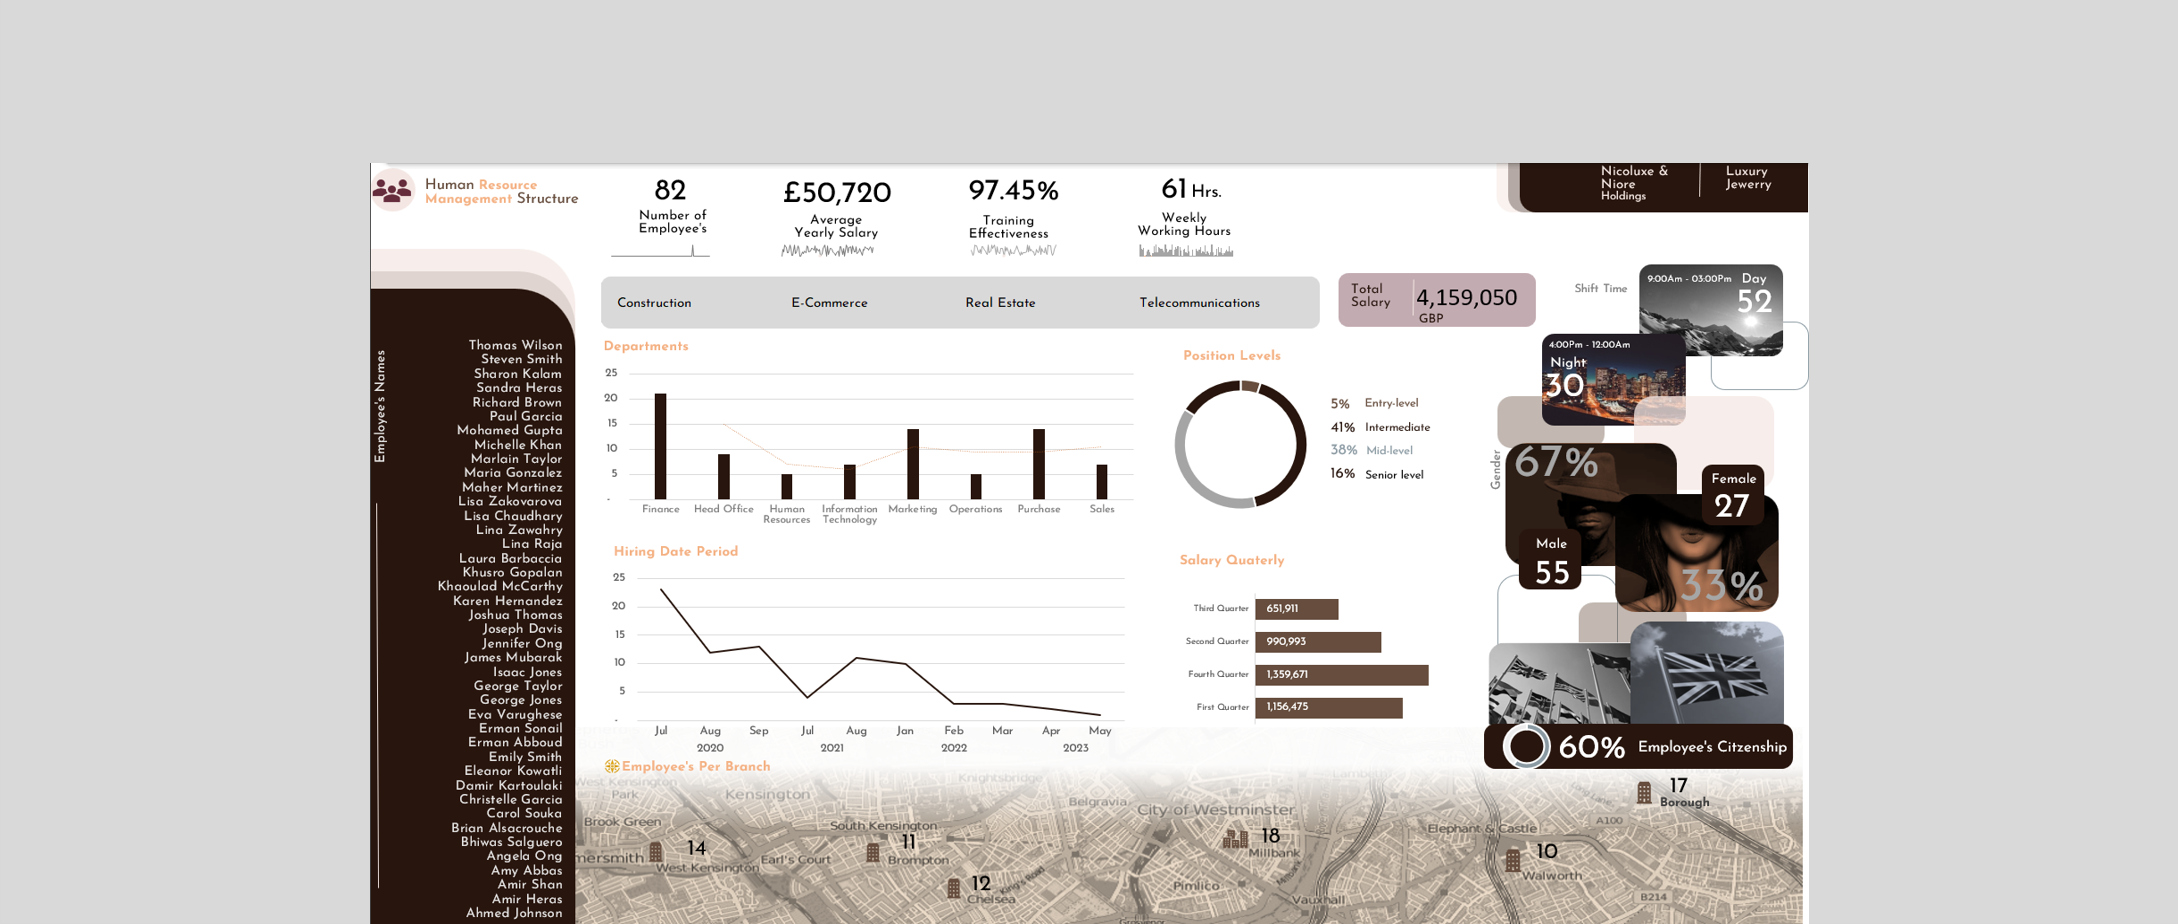
Real-Estate Workforce HR Dashboard
Built an HR dashboard visualising headcount, gender mix and seniority. Revealed payroll and staffing trends, cutting project turnaround to 61 hours with a 97.45% task completion rate.

Data Scientist, Data analyst
I am a Data Scientist & Analyst with 2+ years building machine learning models, automations and dashboards. I help businesses make sense of their data by building unique systems and tools around their specific issue, making decision making faster, clearer and more reliable. The final build is easy for everyone on your team to work with, not just the technical side.
If you are a business, let the work on this page speak for itself. If you are looking to hire, you are already in the right place.
DOWNLOAD CV
Cleaning and preparing raw data by handling missing values, outliers, encoding and normalisation to make sure analysis is built on solid ground.

Building dashboards and charts in Matplotlib, Seaborn, Plotly, Power BI and Excel that give decision-makers a clear picture of what the data is saying.

Building and training machine learning and deep learning models that solve specific business problems, from classification and regression to neural networks.

Improving model performance by creating meaningful variables from existing data through transformations, aggregations and domain-specific calculations.

Writing clear reports and presenting findings to both technical and non-technical audiences in plain language that leads to action.

Available for urgent data needs, dashboard maintenance, model updates and new projects across time zones.
Mount Kenya Ewaso Water Partnership
Collected and analysed household data on farming practices and fuel usage. Led farmer training sessions contributing to a 40% reduction in firewood use and a 25% increase in farm productivity.
African Leadership Experience
Developed practical skills in statistical analysis, machine learning and data visualisation using Python, SQL, Excel and Power Bi that have enhanced my analytical and problem-solving abilities for practical projects.
Excel
95%SQL
90%PowerBI
85%R
90%Python
90%NLP
85%Machine Learning
85%Deep Learning
90%
Built an HR dashboard visualising headcount, gender mix and seniority. Revealed payroll and staffing trends, cutting project turnaround to 61 hours with a 97.45% task completion rate.

Built a deep learning model for Google stock price prediction using 20 years of historical data, moving averages and volatility indicators. Deployed that model as a Streamlit dashboard for live forecasting.
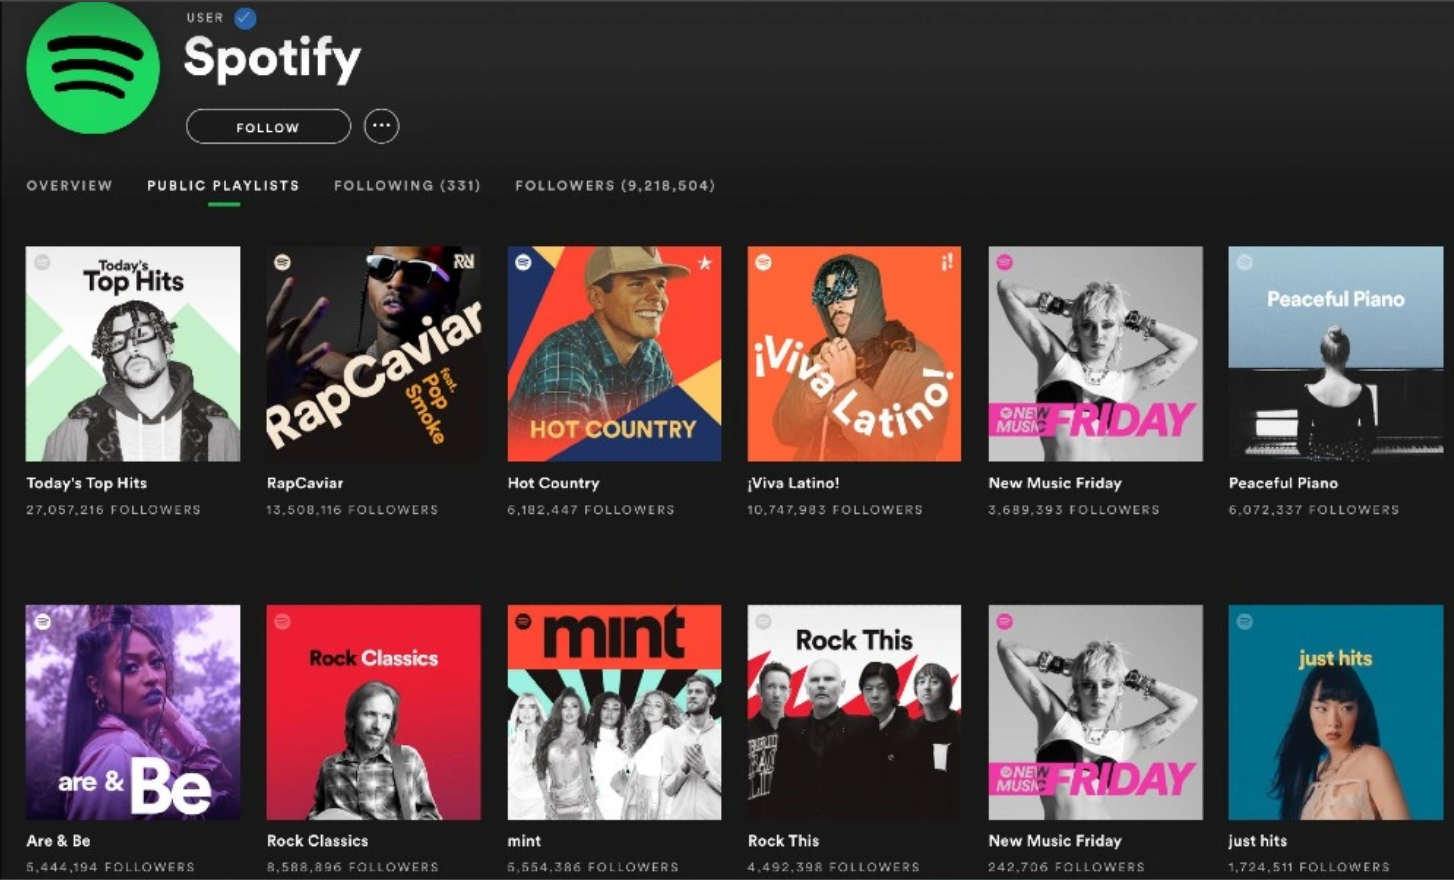
Analysed 20K+ tracks to identify audio features driving popularity. Energy, danceability and loudness came out as the strongest predictors of viral success. Cross-referenced Spotify and YouTube data to inform release strategy.
Analysed 2,000+ US retail transactions to identify what drives revenue and margins. Electronics led on revenue, Beauty on margins. Seasonal peaks and high-value customer segments pointed to where campaigns should focus.
Analysed 100K+ Olist orders to find where sales and logistics could improve. Identified regional growth patterns, delivery delays and customer segments by behavior.

Used K-means clustering to segment e-commerce customers by spending, returns and behavior. identified high-value segments and used that to improve targeting and retention.

Processed data on 16K+ players to find performance patterns. Built player similarity algorithms using K-means and hierarchical clustering to support scouting and team selection decisions.
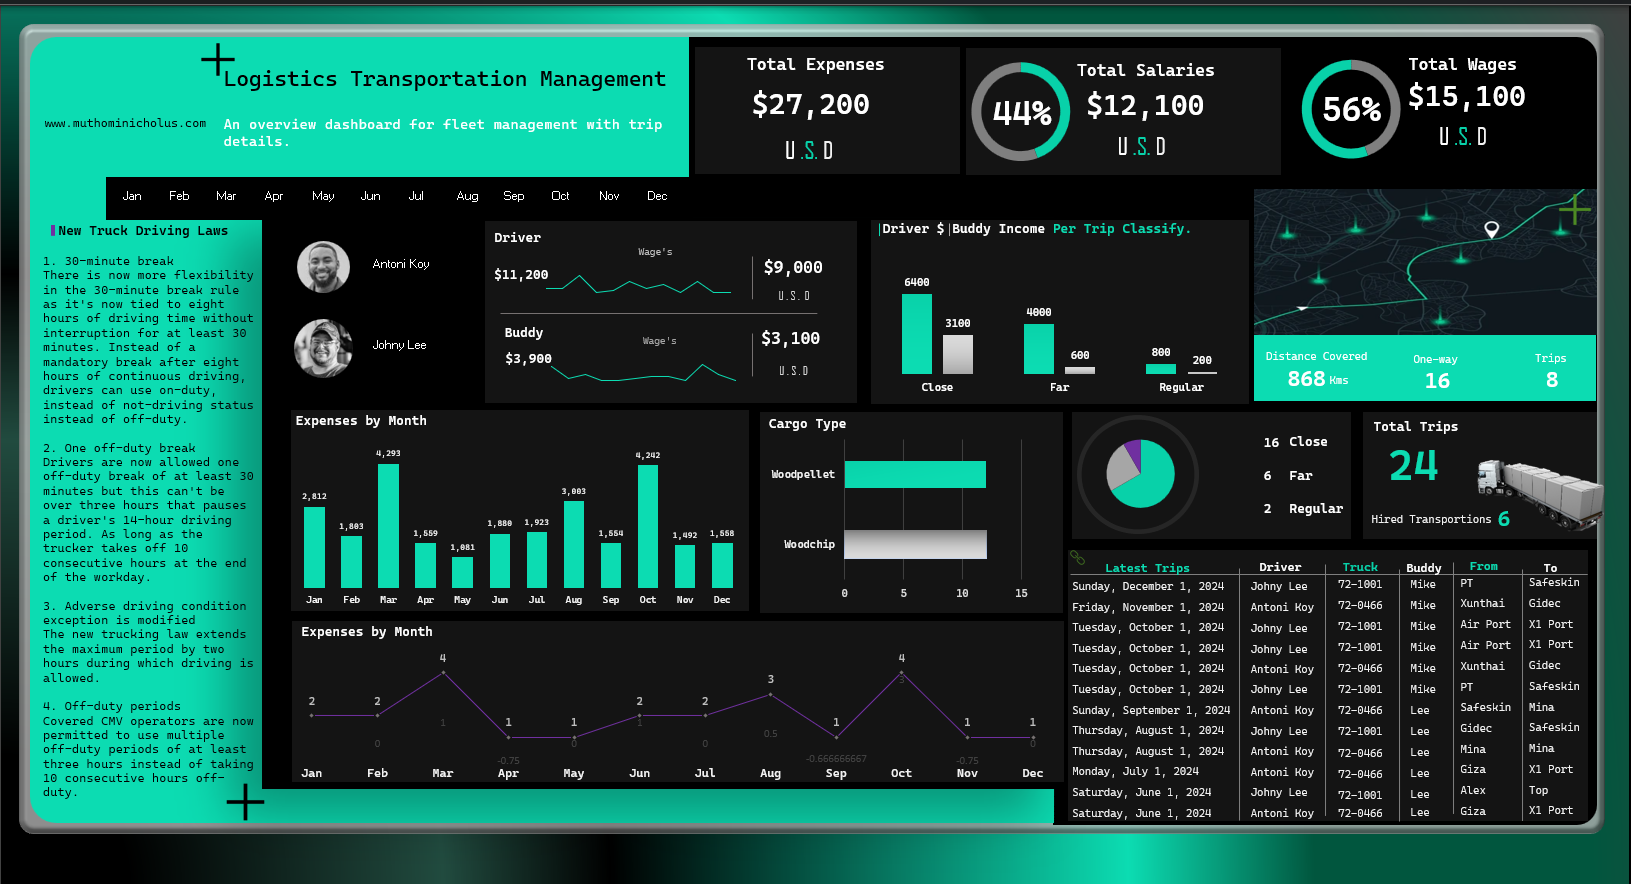
Built a dashboard tracking driver income, trips, expenses, cargo types and route performance. Monthly cost and performance data gave managers what they needed to make better scheduling and route decisions.
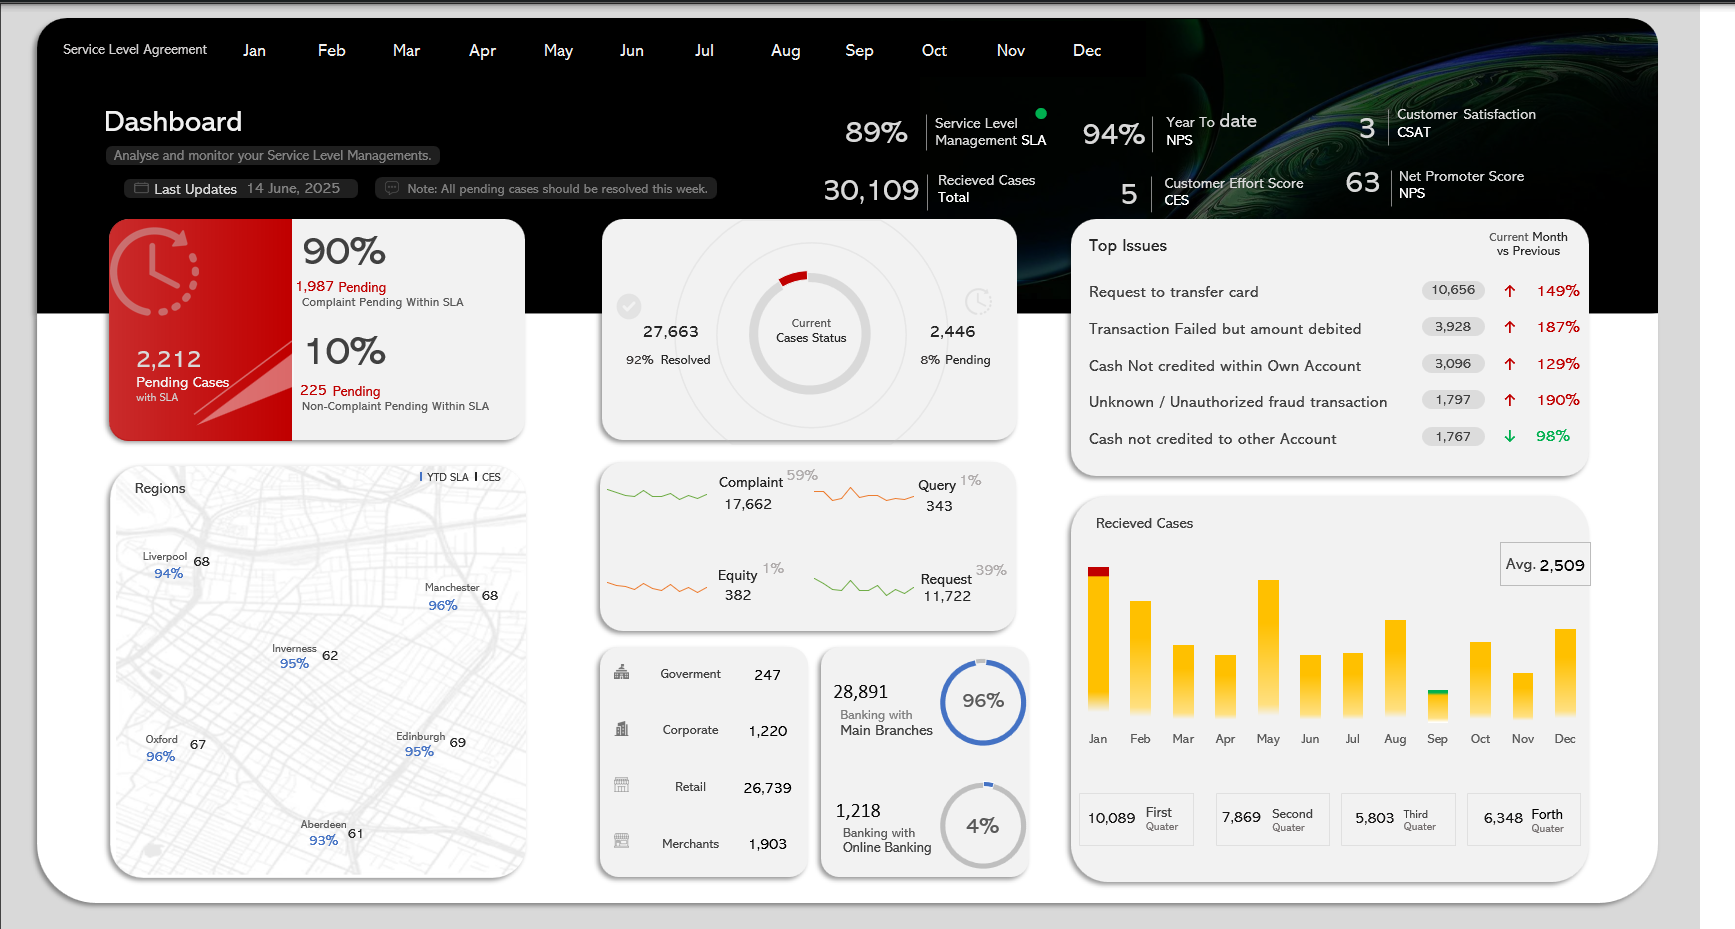
Built a dashboard tracking service KPIs across banking products. Raised SLA compliance to 94% with a 92% overall resolution rate across six cities in UK.

Developed a filtering recommendation system that predicts user preferences by evaluating user ratings. Implemented as a customised recommendation web application with Streamlit.
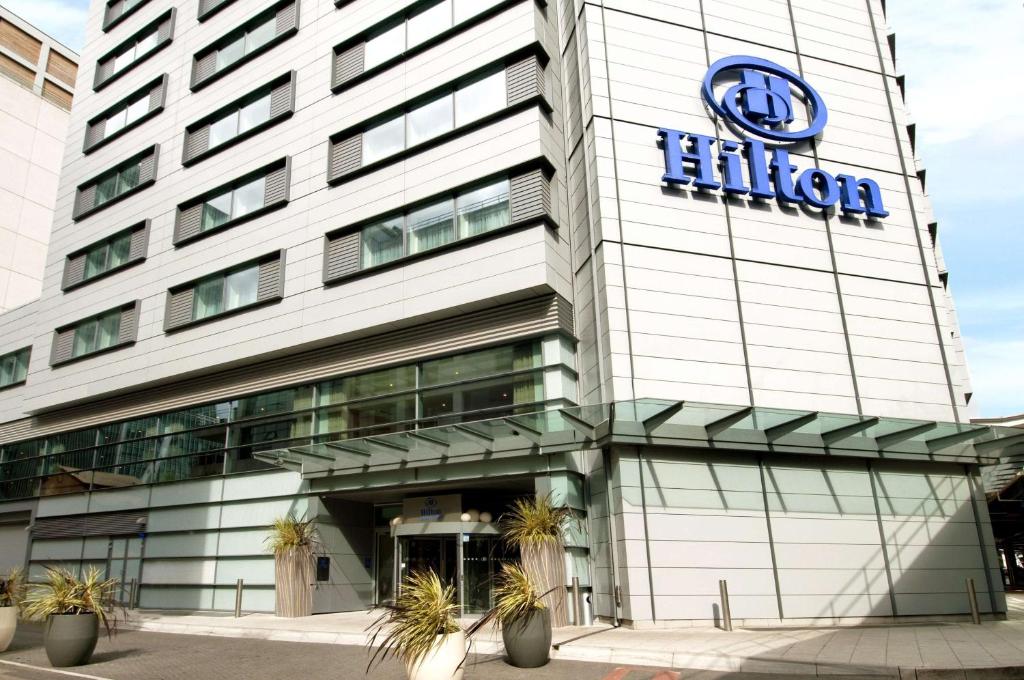
Analysed 5,000+ Hilton London reviews using NLP and machine learning, achieving 89% accuracy. 72% of reviews were positive. Staff service and room cleanliness came up most in the negative set.
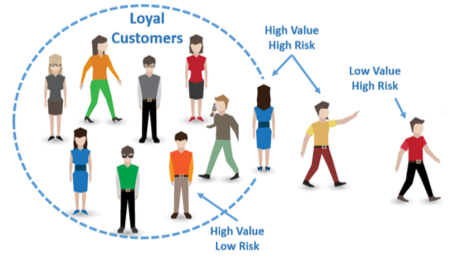
Built an ML classification model predicting customer churn from usage and account data, achieving 79% accuracy in identifying customers likely to leave.

Built a model predicting Indian flight ticket prices from historical booking data. Deployed a Streamlit app where users can estimate costs for different travel scenarios.
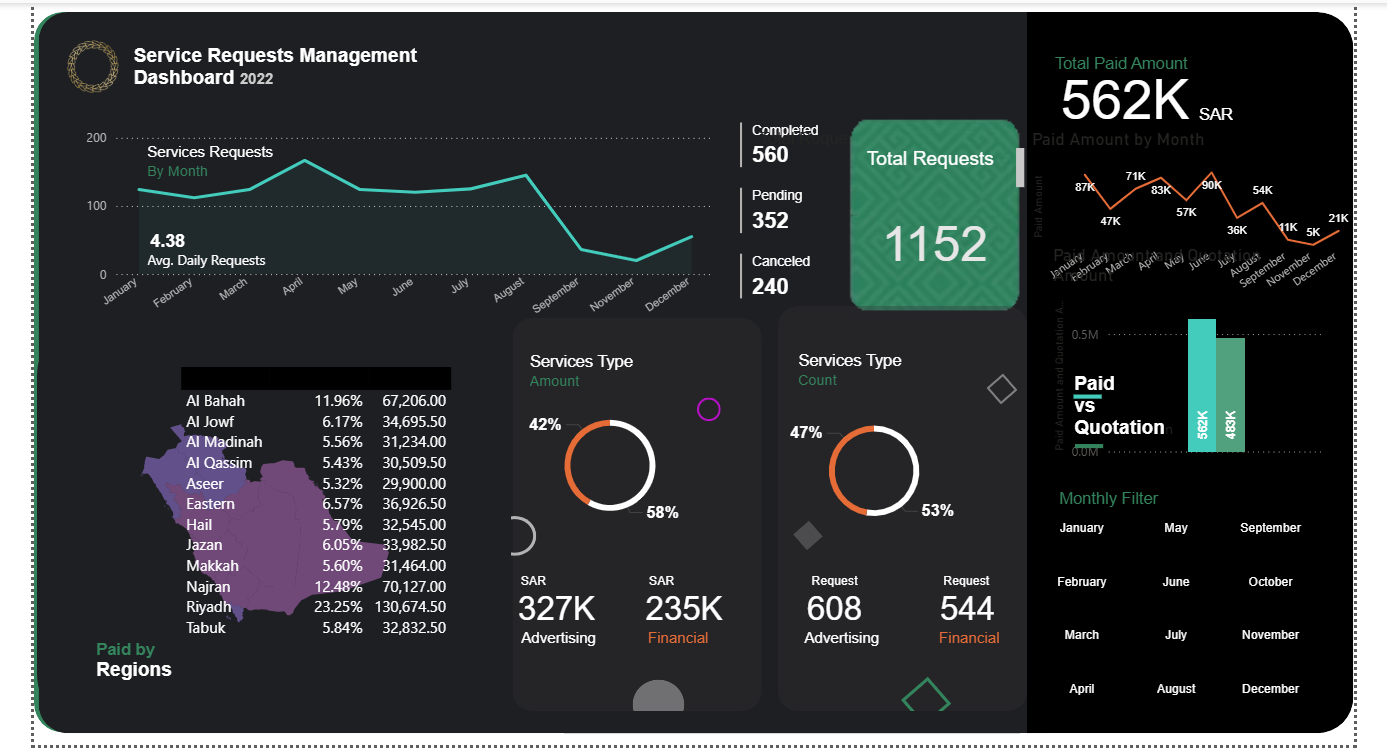
Built a Power BI dashboard tracking 562K+ SAR in payouts across 560 service requests, broken down by service type, region and month. Riyadh accounted for 23% of requests with an average of 4.38 daily requests.

Conducted RFM and market basket analysis on 500K+ transactions to segment customers and identify cross-selling opportunities. The top segments accounted for 80% of revenue and product affinities that informed campaign decisions.

January 15, 2026
Artificial Intelligence (AI) has revolutionized and will continue to ...

January 15, 2026
Employee turnover is one of the most pressing challenges modern...

January 15, 2026
It's easy to assume that more data or cleaner dashboards will...